

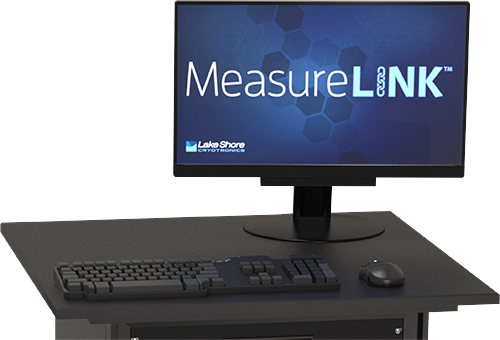
Includes PC workstation with MeasureLINK™
All cryogenic probe stations ship with a PC workstation with our versatile MeasureLINK™ software included. This software provides complete coordination over the experiment with no programming required. Using drag-and-drop control, you can easily control temperature (as well as magnetic field on probe station models that support it) for on-wafer probing measurements performed in your station. You can set up either discrete or continuously varying temperature measurements when using our CVT probes in your station and watch how temperature stabilizes while reaching a set control temperature.
What’s more, a process view window in MeasureLINK displays a view of station internals at different points so you have a better understanding of internal temperature variations, including the temperature at the sample stage and on the probe arm (as well at other internal points, depending on the probe station model).
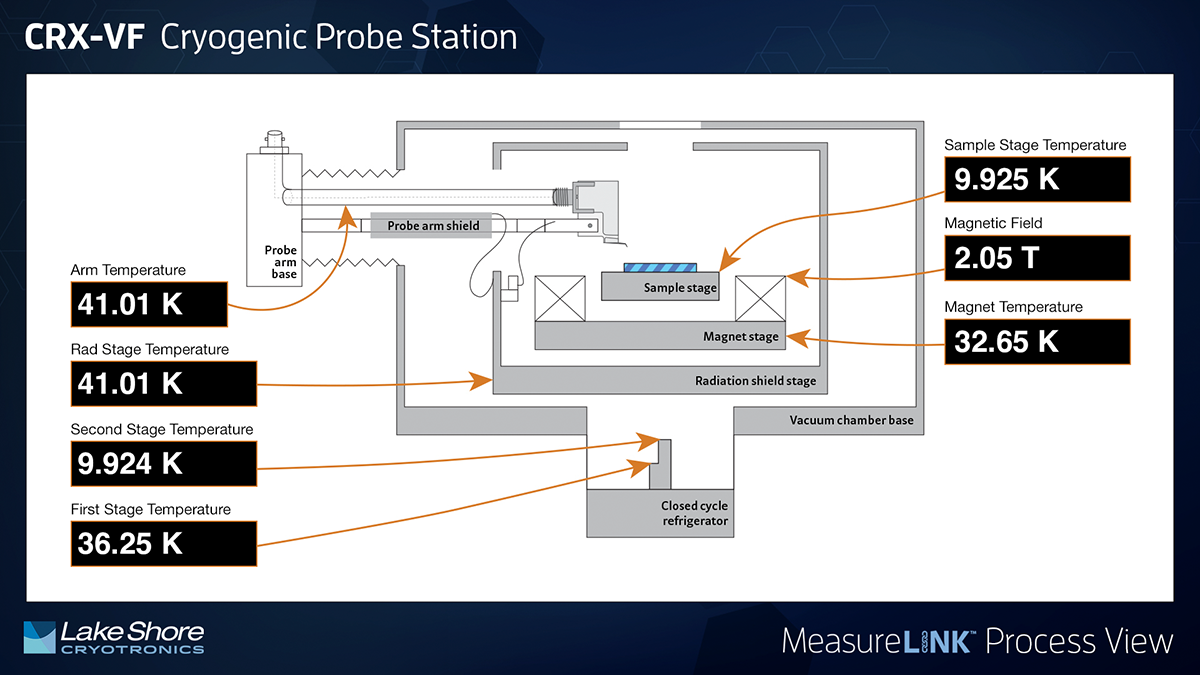
The process view window shows a representation of the probe station internals with the appropriate temperatures highlighted for a better understanding of internal temperature variations. Views differ by probe station model. Shown is a view of the CRX-VF probe station, which also allows characterization as a function of variable magnetic field.
Beyond that, MeasureLINK also allows you to use a single GUI to control many aspects of an experiment in a setup that includes other Lake Shore products as well as some third-party instruments. For example, you can characterize material or device samples in a probe station with our modular MeasureReady™ M81-SSM synchronous source measure system conducting the measurements. In this setup, MeasureLINK allows you to execute current and voltage output sweeping with coordinated synchronous measurements, collect IV curves, and more.
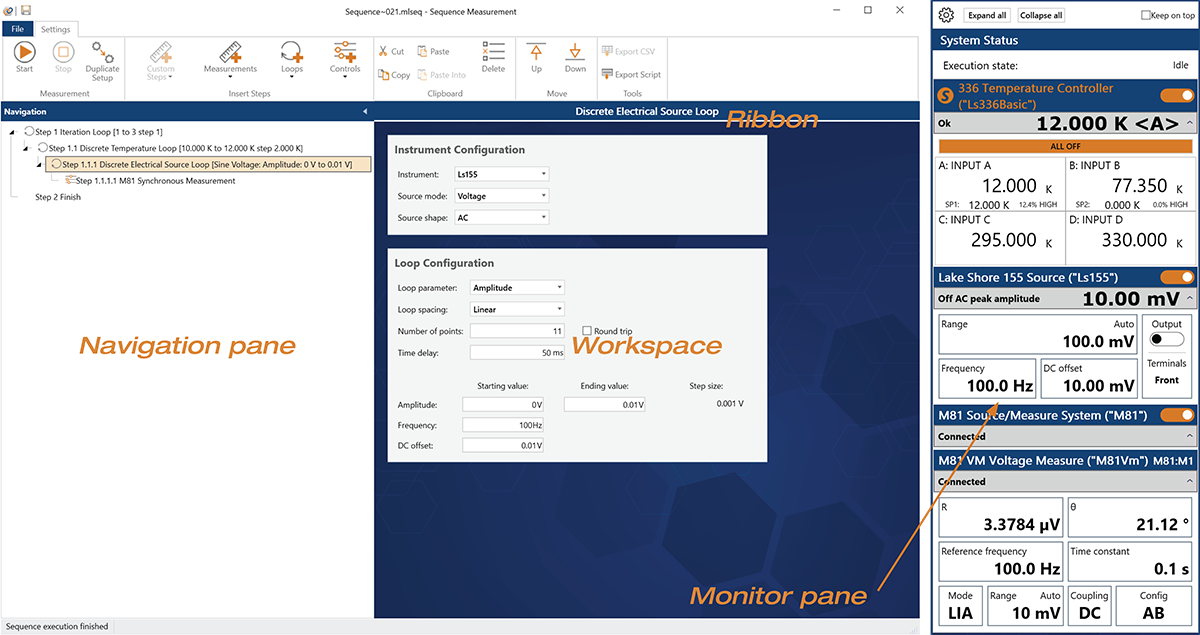
The MeasureLINK interface, with the monitor pane displaying Lake Shore MeasureReady instruments also used in an experiment.
MeasureLINK also enables data collection visualization in real-time and allows you to create a specific multi-variable chart for any data-collection sequence. A chart recorder utility enables you to monitor certain variables, such as temperature trends, in real-time to keep a close eye on an experiment, allowing you to confirm that an experiment is progressing as you intended so you’re not wasting time.
Construct an experiment by selecting a sequence of pre-written functional steps to control the environment and collect data, automatically stepping through your defined sequences. Sequences and script examples are included, and the software’s scripting engine allows you to construct new measurement scripts, giving you complete control over every aspect of your characterization experiment. You can also collect data from the experiment and export it to your favorite analysis tool. No problem is too complex to handle with MeasureLINK.
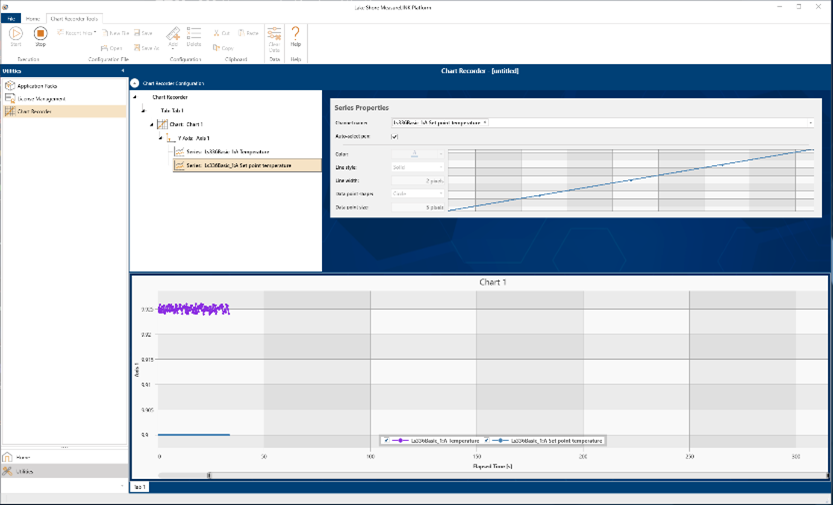
The chart recorder utility enables charting and logging of all variables relating to measurements conducted in a probe station in real time and helps you determine when certain steady‑state conditions have been reached.
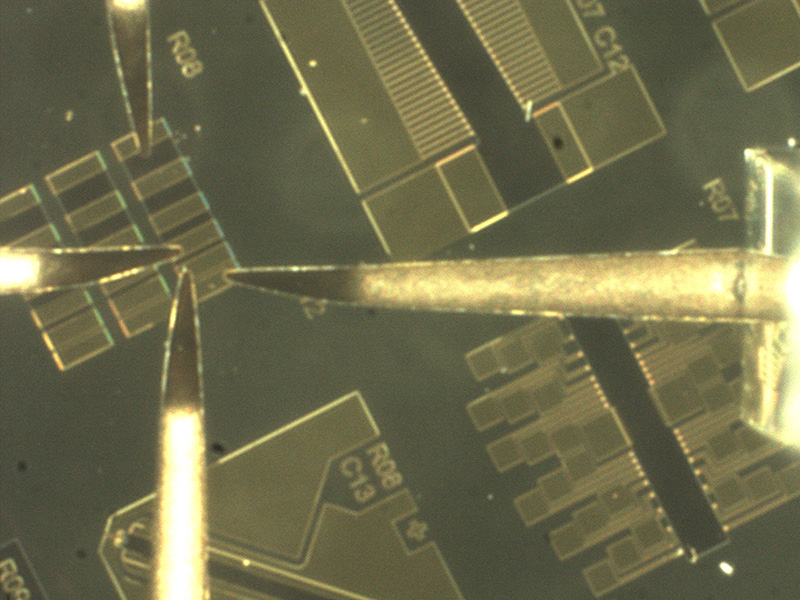
The probe station’s vision system image (a magnified image of the probes landed on the sample in the chamber) is also available on the PC screen.